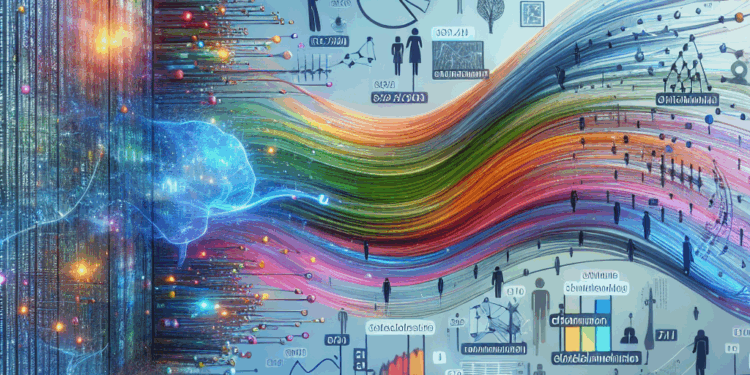
In an era increasingly dominated by data, the ability to translate abstract numbers into meaningful stories has become crucial. At the intersection of this transformation lies the synergy of Artificial Intelligence (AI) and data visualization. Together, they empower organizations to not only interpret vast quantities of data but also present it in a way that resonates with audiences, driving insights and informed decision-making.
The Power of Data
Data is a treasure trove of insights, revealing patterns and trends that can inform strategic actions. However, raw data in spreadsheets or databases can often feel overwhelming. To derive meaningful insights, it must be processed and visualized. This is where data visualization comes into play. Through charts, graphs, and interactive dashboards, complex datasets can be simplified and made accessible. But while visualization provides clarity, the integration of AI adds an additional layer of sophistication.
AI’s Role in Data Interpretation
Artificial Intelligence enhances the process of data visualization by automating insights generation and making predictions. Advanced algorithms can analyze vast datasets far quicker than any human can, identifying trends and anomalies that might go unnoticed. This process, often referred to as predictive analytics, allows organizations to foresee potential outcomes, making data not only more relevant but also actionable.
For instance, consider a retail company analyzing consumer behavior. AI can sift through enormous amounts of transaction data to highlight not just current buying patterns but also forecast future trends based on historical data. When paired with advanced visualization techniques, such as heat maps showing peak shopping times or bar graphs detailing most popular products, a compelling narrative emerges that helps stakeholders make informed decisions about inventory and marketing strategies.
Crafting Effective Narratives
The true power of combining AI and data visualization lies in storytelling. Stories are intrinsically human; they create emotional connections and enhance understanding. By translating data into narratives, organizations can effectively convey the significance behind the numbers. AI tools can assist in this narrative crafting by identifying key data points, suggesting visual formats, and even generating textual summaries that contextualize the visuals.
Consider how a healthcare organization might present patient data. Instead of just displaying statistics about patient recovery rates, AI can help visualize these figures in compelling ways, such as through infographics that combine charts with patient stories. This holistic approach encourages greater engagement and comprehension from non-technical audiences, such as patients or policymakers, who may not be adept at interpreting raw data.
The Future of AI and Data Visualization
As we move forward, we can expect AI and data visualization to continue evolving hand-in-hand. Machine learning models will become more adept at understanding the nuances of data, allowing for even more sophisticated visual storytelling. Additionally, the increasing accessibility of AI tools will empower businesses of all sizes, democratizing data analysis and enabling them to harness the power of their own data for strategic gains.
In conclusion, the synergy of AI and data visualization represents a significant shift in how we approach data. By translating numbers into narratives, organizations can not only enhance their understanding of complex datasets but also communicate insights effectively. As technology continues to advance, the ability to tell compelling stories through data will become an invaluable asset, enabling smarter decision-making and fostering deeper connections across sectors. The future is not just about having data; it’s about harnessing it to create meaningful narratives that inspire action and understanding.


